

Tour KLSTR.ctrl in demo mode
Demo mode fills KLSTR.ctrl with a ready-made rig, so you can learn the app before you connect any hardware. There are two demo rigs: one of KLSTR.one fixtures (fixtures with a KLSTR network module, cabled to each other over Ethernet) and one of Art-Net nodes with RDM fixtures and KLSTR.nano modules on their DMX lines. You can load one or both. The demo devices don't exist on your network, so as long as you haven't selected a real network interface, nothing you try here reaches a real rig.
This is the second step of the getting-started tutorial. It takes about ten minutes.
Before you start
- KLSTR.ctrl installed and open. See Install and launch KLSTR.ctrl.
- No hardware needed. You don't need a network connection or devices. If you already selected a real interface in an earlier session, real devices can show up next to the demo rig: leave them alone during the tour.
- Nothing to lose. Leaving demo mode clears the topology, so start the tour before you discover a real rig, or save your discovered devices first.
Tour the app
Open the KLSTR.one interface dialog
KLSTR.ctrl talks to KLSTR.one fixtures and to Art-Net nodes through a network interface of your computer, one for each. The header at the top left shows both connections: KLSTR.one and KLSTR.nano (the KLSTR.nano connection is the Art-Net one, because KLSTR.nano modules talk RDM over Art-Net).
Click KLSTR.one in the header. You can also choose KLSTR.one › Select interface (press Cmd Shift I on macOS, Ctrl Shift I on Windows).

The interface dialog opens. It lists the network interfaces of your computer, with a yellow DEMO entry at the top.
Load the KLSTR.one demo
Click DEMO.
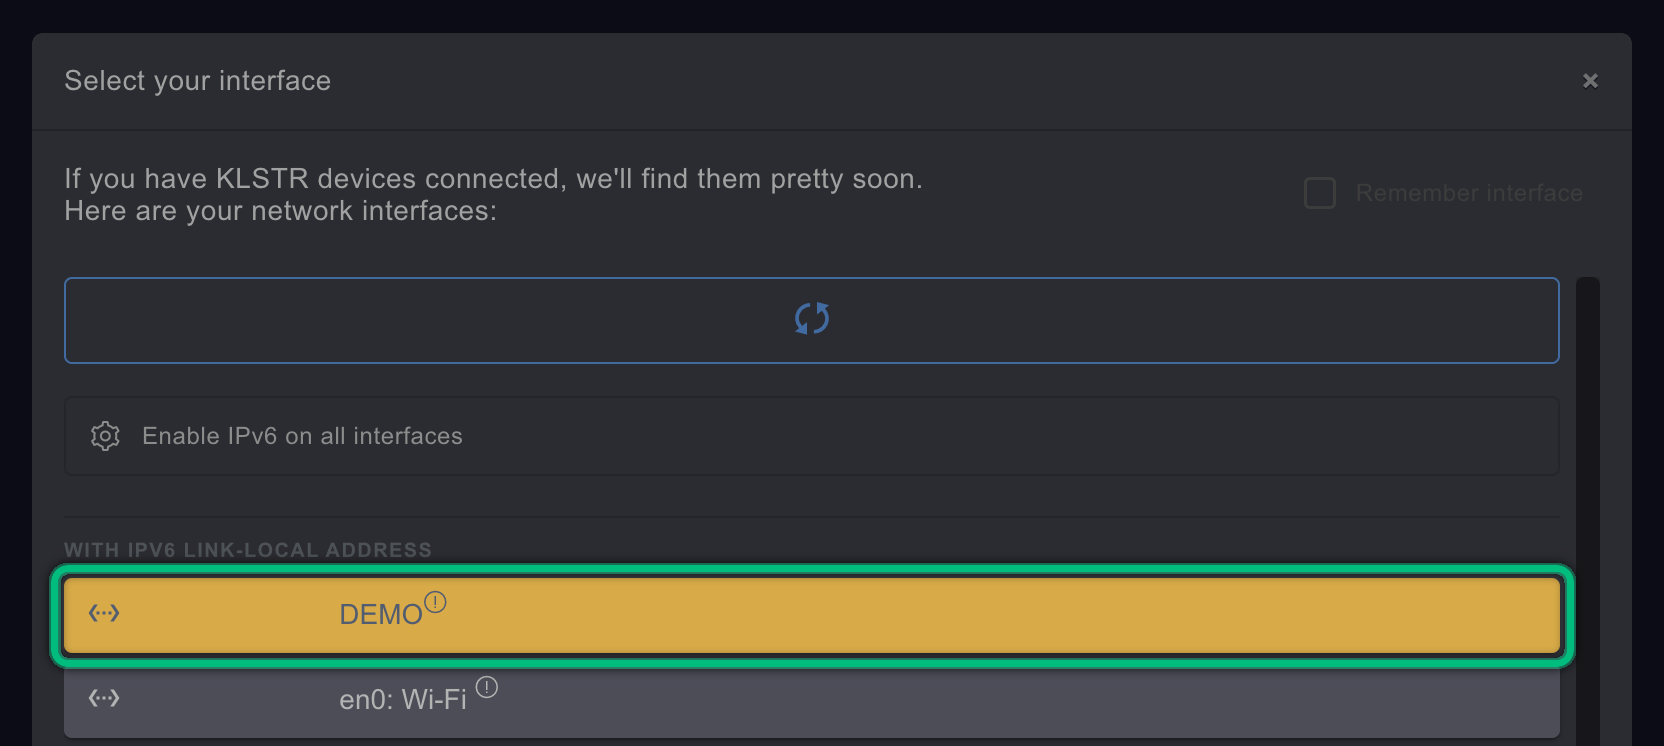
The demo rig loads behind the dialog straight away. The dialog stays open: close it with the × in its top-right corner or with Esc.
The view may open zoomed in on part of the rig. Click Fit view in the bottom-left corner of the view (or press c) to see all of it.
Clicking DEMO loads the KLSTR.one demo rig; after closing the dialog, Fit view shows all of it in the Network Topology tab.Look at the Network Topology
The Network Topology tab shows the network as KLSTR.ctrl sees it. Each box is a root device, here a fixture with a KLSTR.one module, and each line is an Ethernet link between two of their ports. In the header, the status dot next to KLSTR.one is orange, and the mode switch at the top right reads Demo Mode instead of Build Mode and Live Mode.
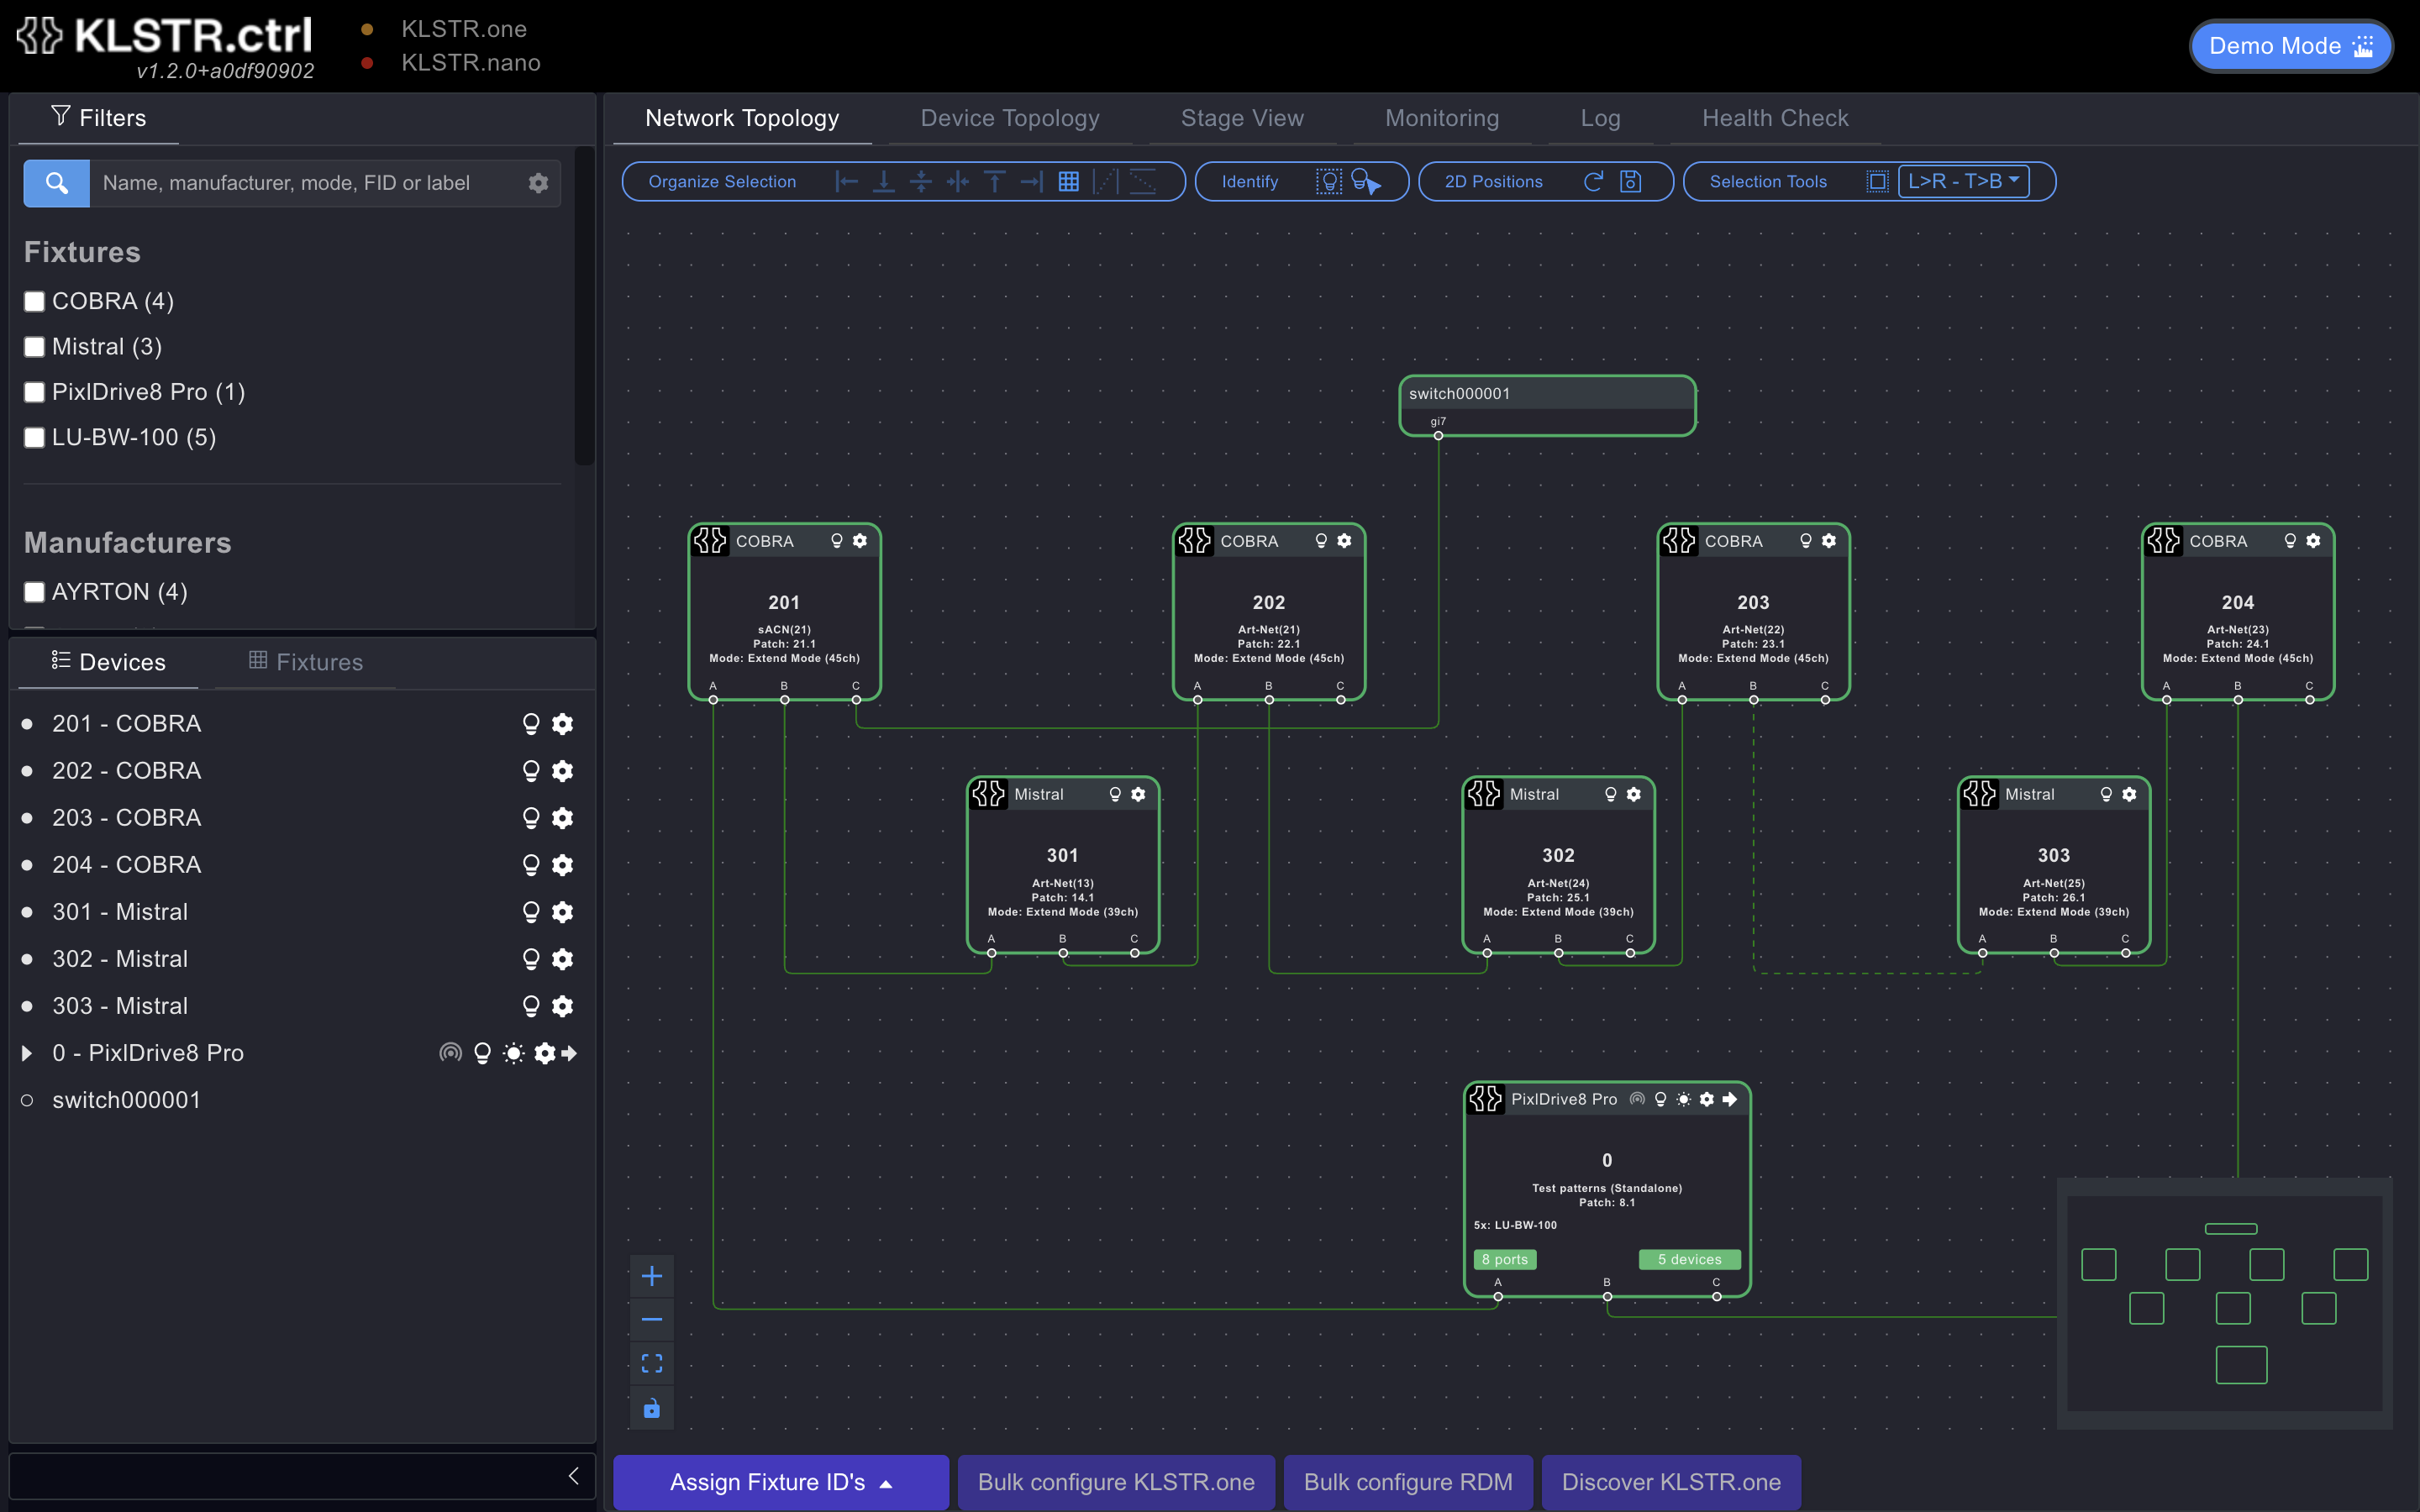
Scroll to zoom, and drag an empty part of the view to pan. The toolbar along the bottom holds the actions for the selected devices, such as Assign Fixture ID's and Bulk configure KLSTR.one. See Navigate the topology views.
Switch to the Device Topology
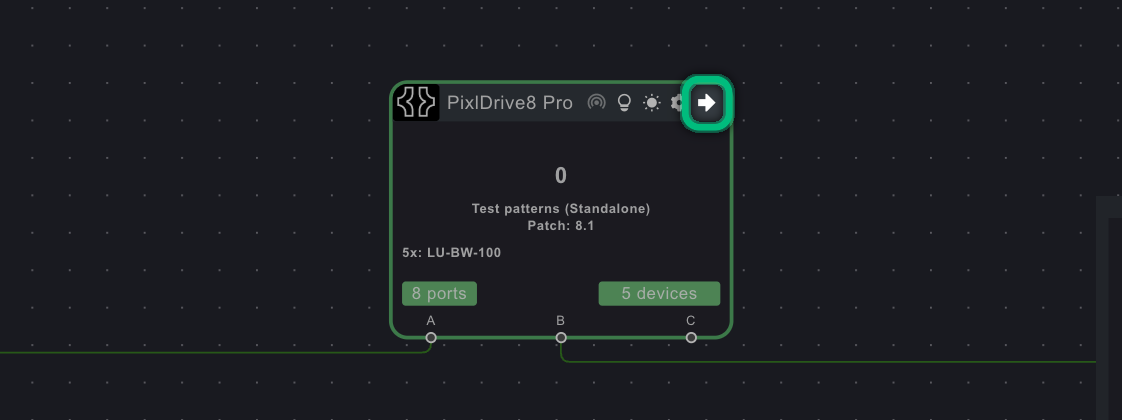
Click Show in detail view, the arrow at the right end of the title bar of the PixlDrive8 Pro node.
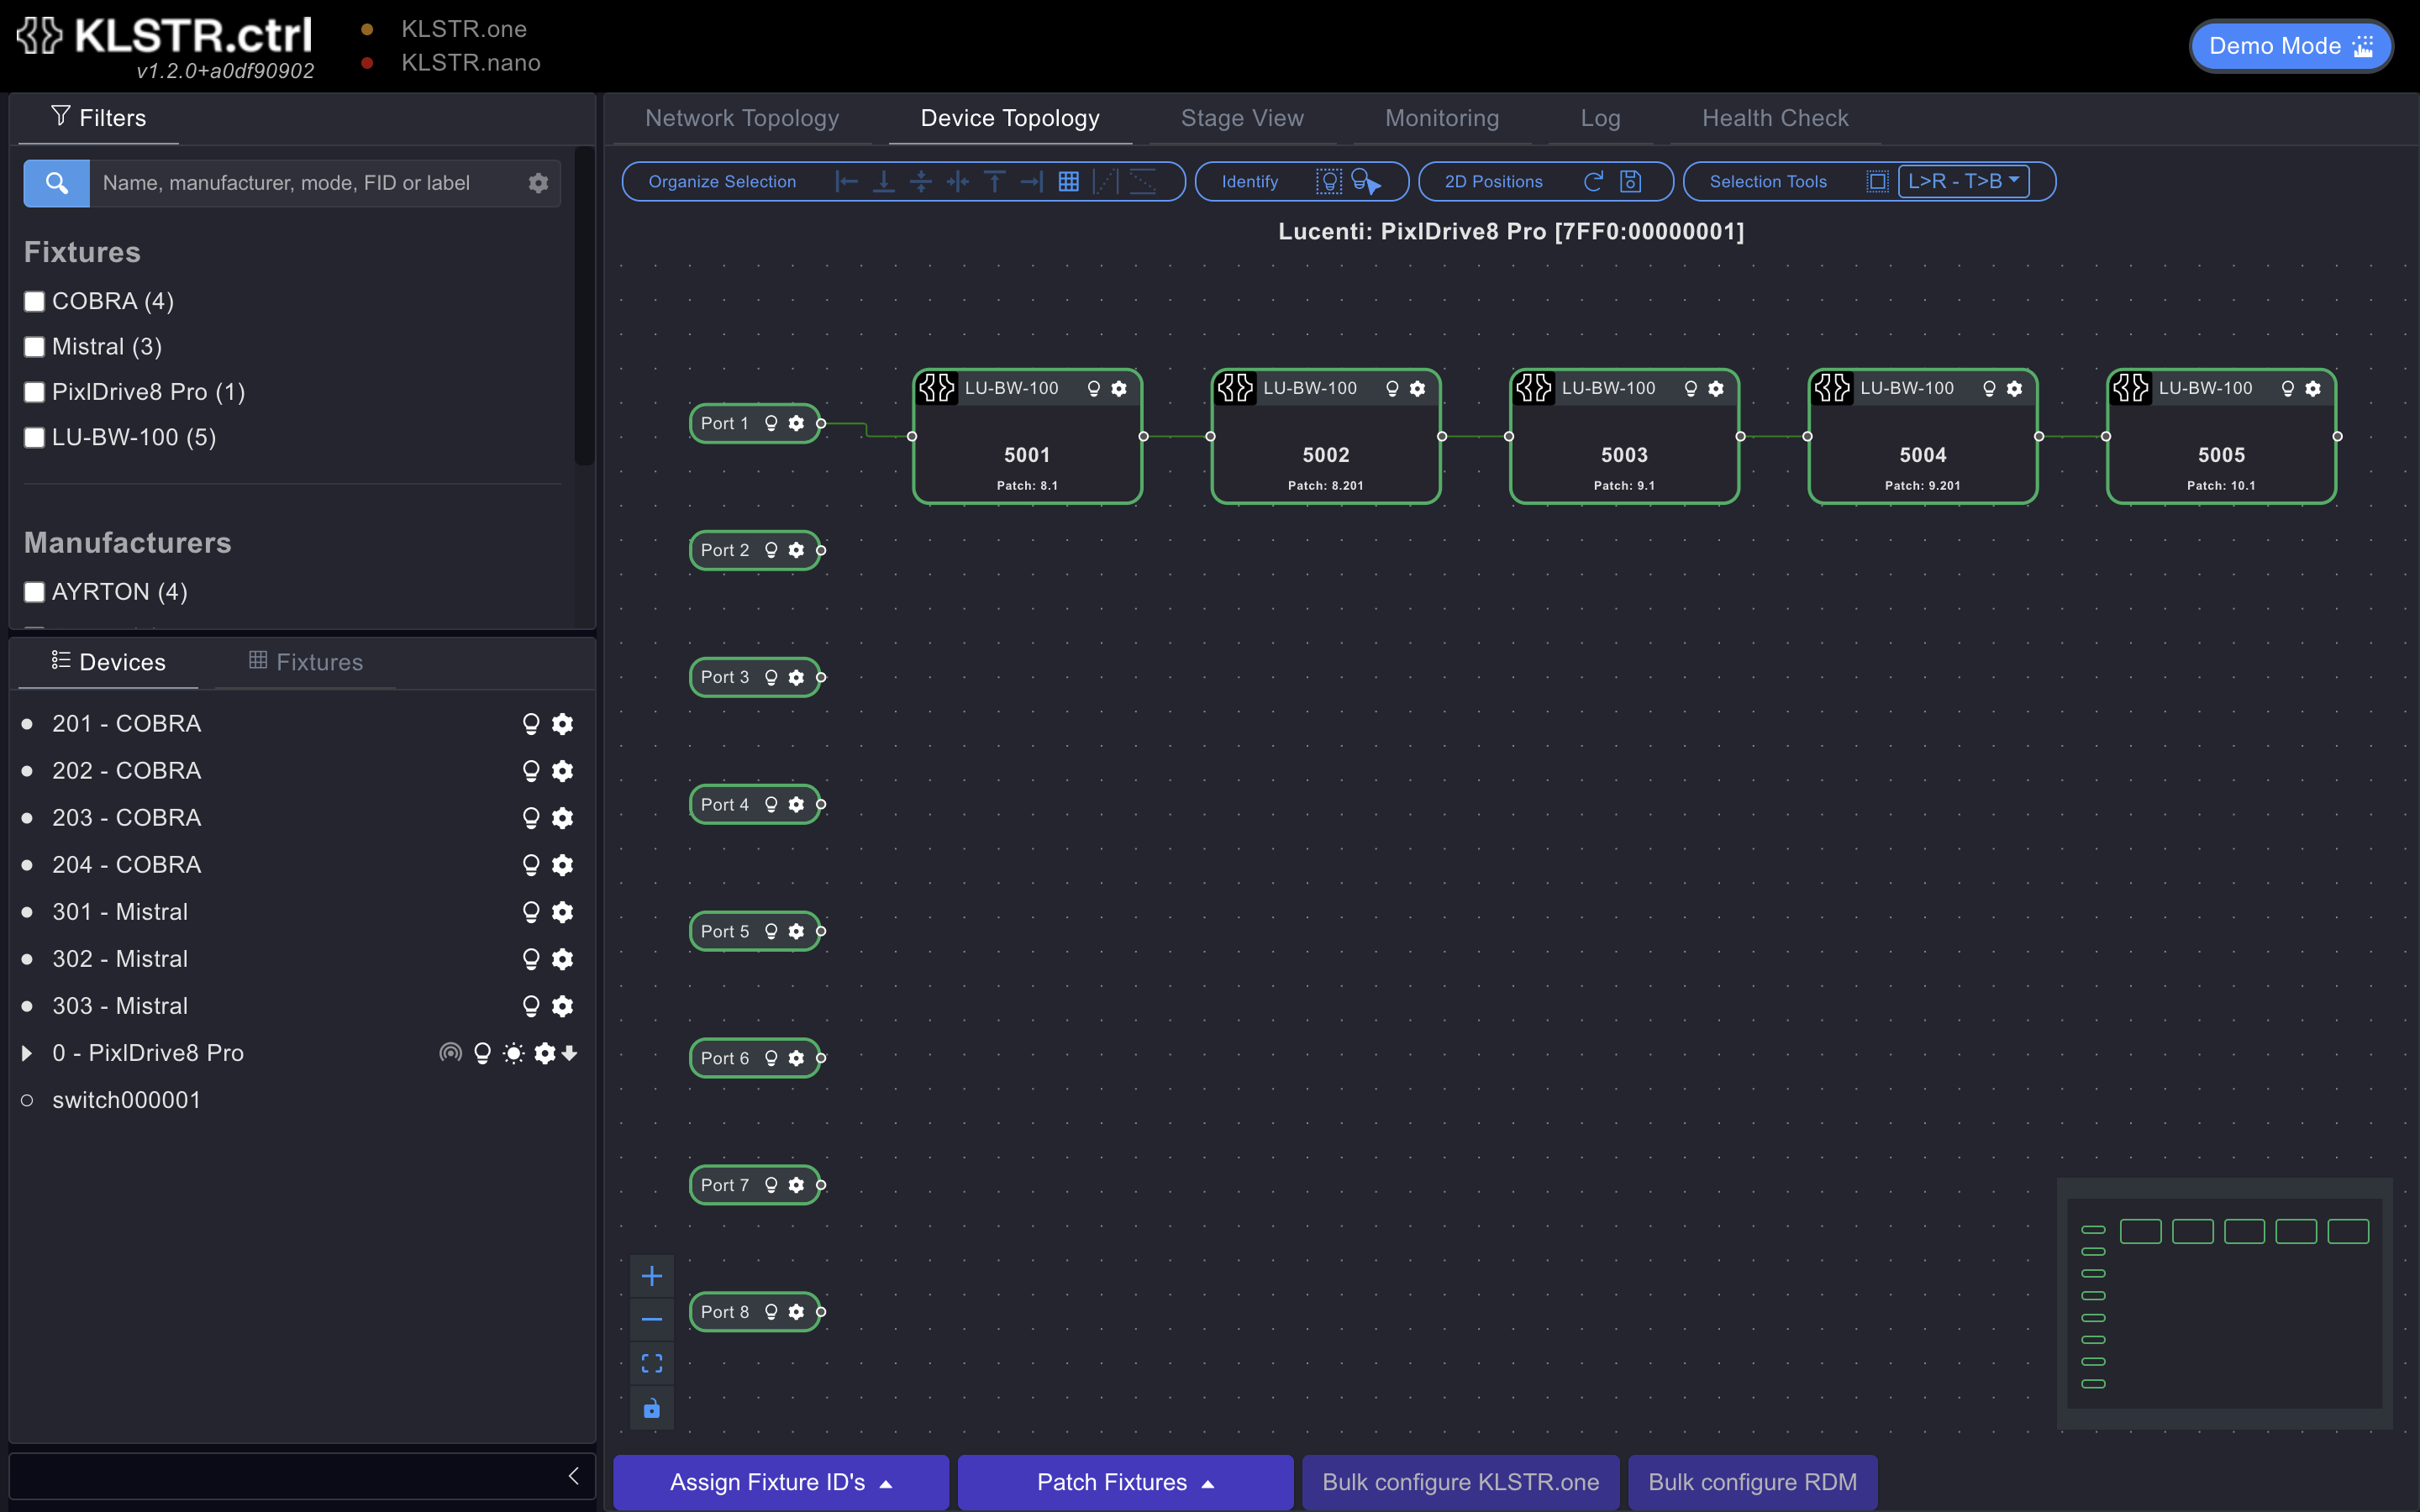
The Device Topology tab opens on that device. It shows its ports, and the fixtures behind each port. This is where you check what is patched where. You can also double-click a node below its title bar. The tab shows one device at a time: opened before you choose one, it reads No device selected.
Find devices in the sidebar
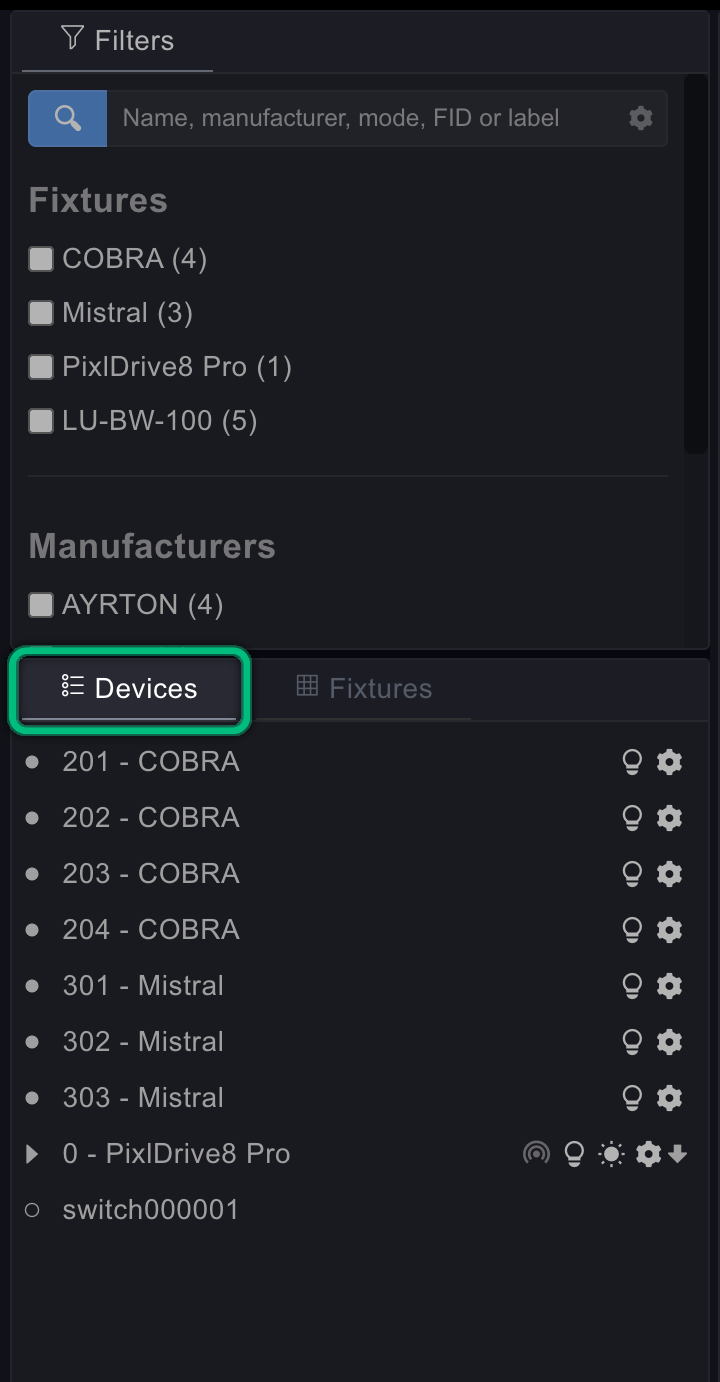
The sidebar on the left has three tabs: Filters, Devices and Fixtures. Click Devices to see every root device in a tree; expand a root device to list the devices behind it. Clicking a device's name selects it in the topology. See Find devices with the sidebar.
Look at the other tabs
The remaining tabs, Stage View, Monitoring, Log and Health Check, show the same devices in other ways:
- Stage View places the fixtures in 3D, for example from an MVR file.
- Monitoring shows sensor values and eDMX statistics.
- Log lists what KLSTR.ctrl did and what the devices reported.
- Health Check lists problems it found, with a warning sign on the tab when there are any.

Add the Art-Net demo
Click KLSTR.nano in the header, below KLSTR.one. The Art-Net interface dialog opens, titled Select your Art-Net interface. Click DEMO and close the dialog.
Two Art-Net nodes join the rig, with RDM fixtures and KLSTR.nano modules on their DMX ports. Look at them in the Device Topology tab.
Leave demo mode
Click Demo Mode at the top right.

The Exit demo mode dialog warns that leaving demo mode clears the current topology and brings you back to Build mode. Click confirm.
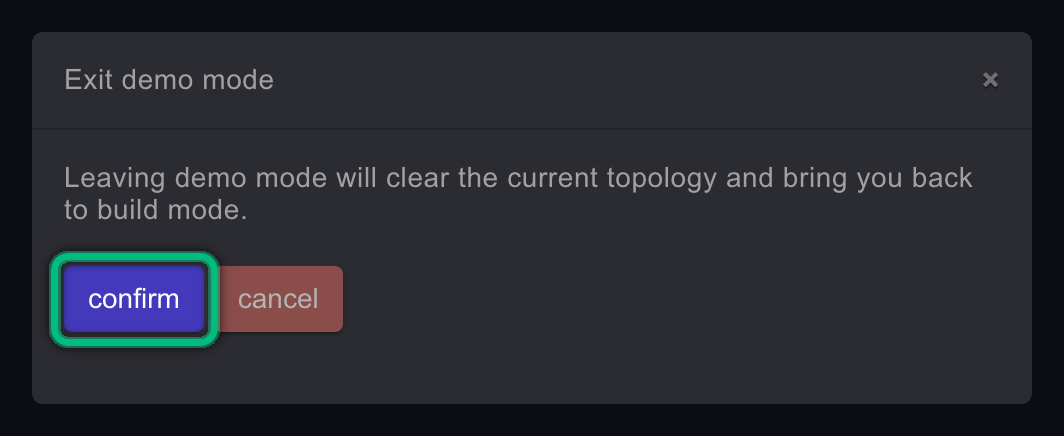
Click cancel instead to stay in demo mode.
What you should see
- The topology is empty again, and the mode switch at the top right shows Build Mode and Live Mode, with Build Mode active. Build mode and Live mode are the two modes for a real rig: see Switch between Build and Live mode.
- The status dots next to KLSTR.one and KLSTR.nano are red again, unless you had selected a real interface before the tour.
If something goes wrong
| What you see | Likely cause | What to do |
|---|---|---|
| The interface dialog stays open after DEMO | That is normal: it doesn't close by itself | Close it with × or Esc |
| Please setup your interface first before accessing the stage view when you click Stage View | No devices are loaded yet | Load a demo first, or connect to your network |
| There is no Build Mode or Live Mode in the header | KLSTR.ctrl is in demo mode | Leave demo mode with Demo Mode › confirm |
| Real devices show up next to the demo rig | A real interface was already selected when you loaded the demo | That is fine for the tour. Leaving demo mode clears both, and the real devices come back as KLSTR.ctrl finds them again |
Related
Written for KLSTR.ctrl 1.2.0 (a0df909) · Checked 1 Oct 2026
Install and launch KLSTR.ctrl
Download KLSTR.ctrl for macOS or Windows, install it, and get through the prompts you see on first launch.
Connect KLSTR.ctrl to your network
Pick the network interfaces KLSTR.ctrl uses for KLSTR.one fixtures and for Art-Net nodes, enable IPv6 where needed, and let KLSTR.ctrl remember your choice.